🎨 Transforming Playwright tests into Mermaid visualisations
Being able to understand and visualise your test coverage is important, let's see how we can automate this process with Mermaid JS
The idea
I've been experimenting with the possibility of automatically generating Mermaid visual diagrams from Playwright test cases, to help with reporting and test coverage analysis.
Test file
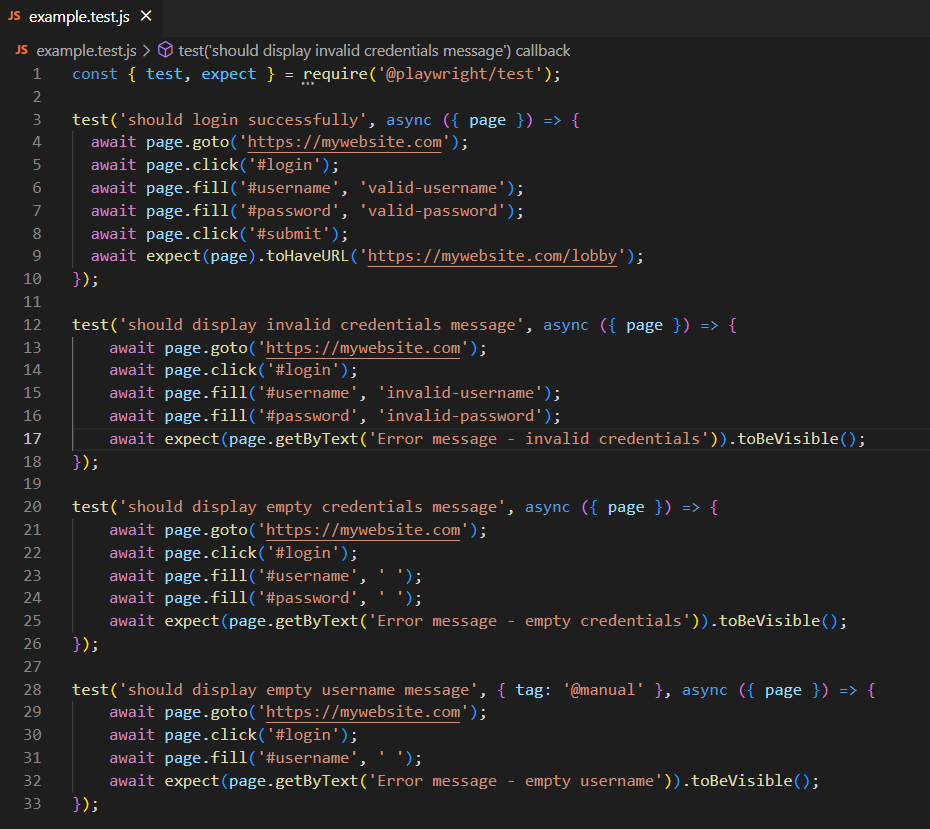
Here is an example of a standard test file with 4 scenarios, with 3 being automated and 1 manual.

Script execution
This is the JS file which converts the test cases into Mermaid syntax, execution is instant. I'll include a link to the repository at the end of to post, it's not perfect but it does the job.

Output file
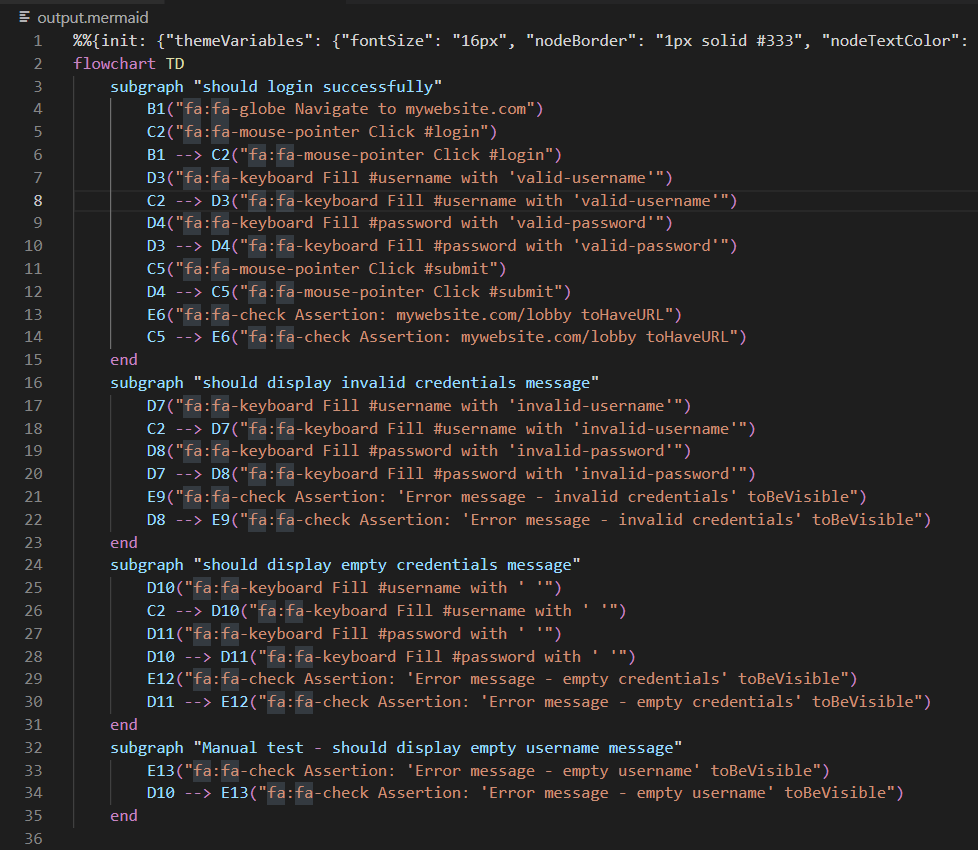
This is the mermaid file that is output, which includes style, structure, nodes and connections.

Mermaid editor
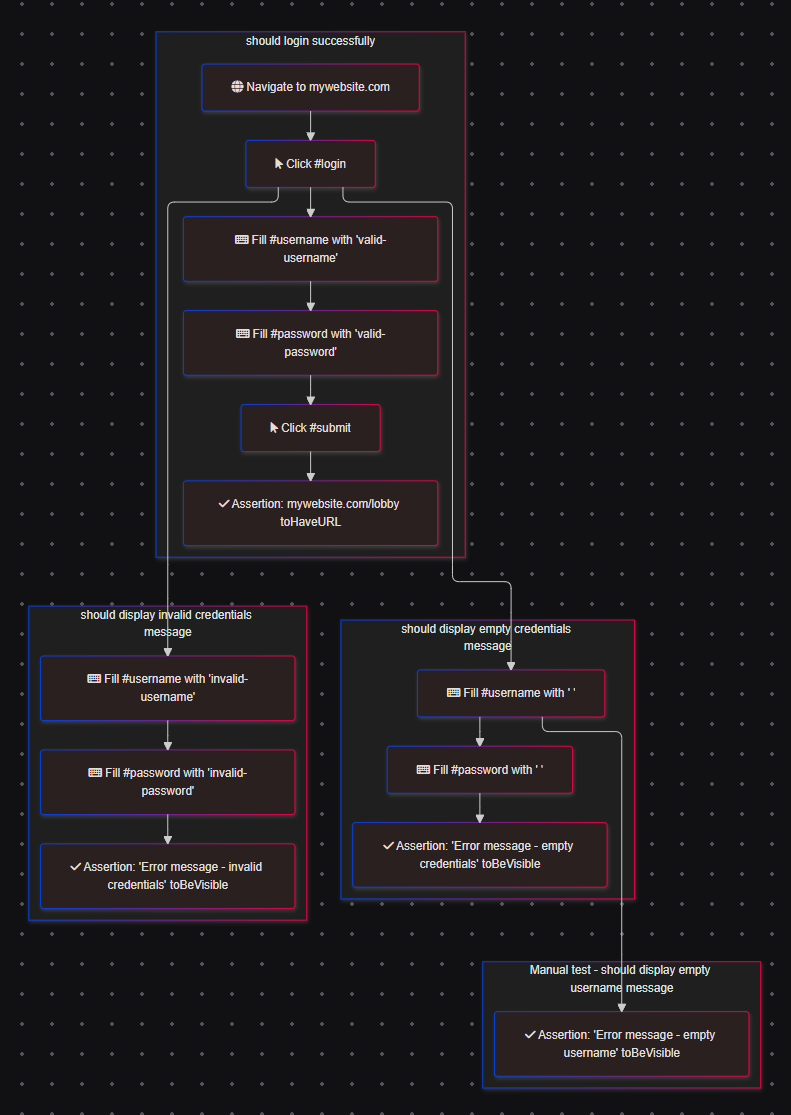
And this is the final result when rendered, it displays all of the tests, journeys and behaviours, and also notes which part is a 'manual test'.

Summary
Let me know what you think - useful? Improvements? It was more of an experiment but I think it could be valuable for drafting up visualisations quickly.
Checkout the script here: https://github.com/qa-gary-parker/mermaid-parse-playwright
And preview the visualisation with the Mermaid Editor: https://www.mermaidchart.com/play